The Ward Insights and Analytics suite provides hospital teams with powerful tools for real-time decision-making, strategic planning, and financial management. From dynamic charts and interactive dashboards to AI-powered forecasting and comprehensive reconciliation tools, this module brings clarity and control to every aspect of ward operations. Explore patient flow trends, analyze historical data, predict future demand, and manage insurance and billing with confidence—all within a single, seamless interface.
🟩 Dynamic Reports & Charts
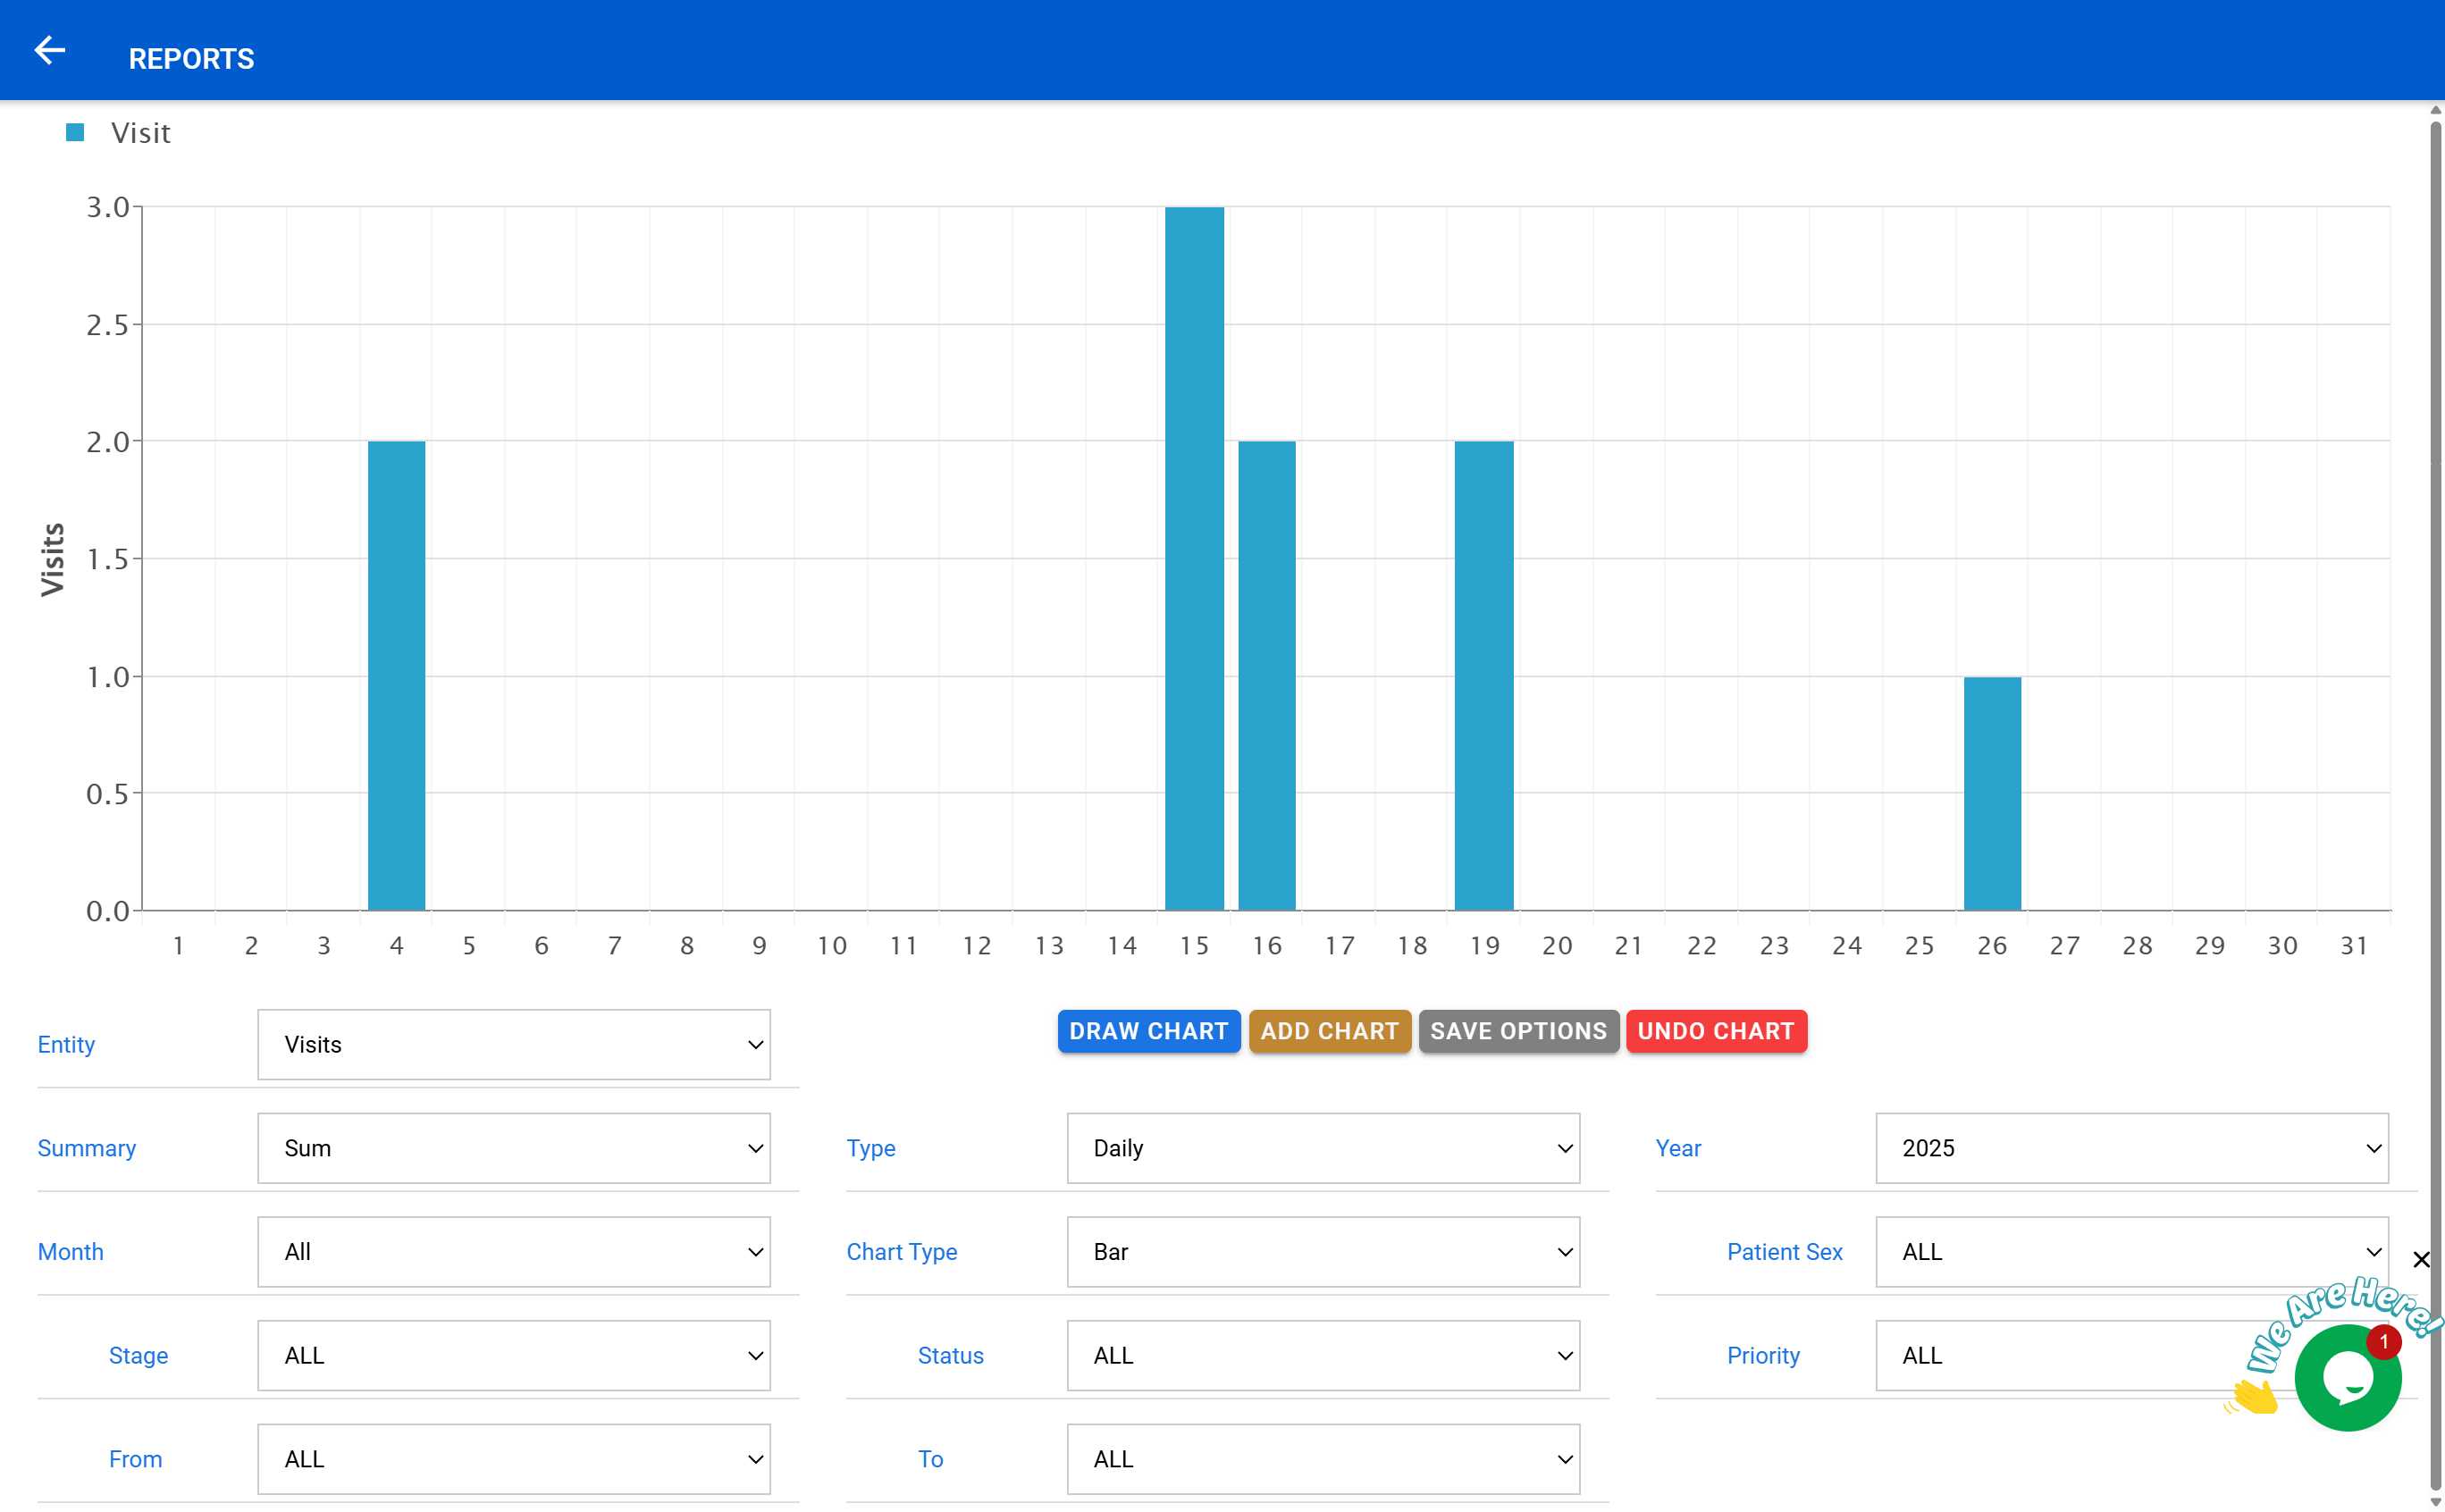
The Dynamic Reports & Charts module gives healthcare teams real-time insights into any data point across the hospital. It allows you to visualize trends, compare metrics, and make evidence-based decisions quickly.
This tool is invaluable for administrators , ward managers , and clinical directors looking to optimize performance and patient care.
📊 Key Features of Dynamic Reports
- Chart Any Entity: Select from visits, admissions, discharges, billing, medications, lab requests, and more.
- Interactive Filters: Apply filters for date ranges, wards, patient demographics, and visit stages.
- Summary Modes: Choose between Sum , Average , and Count .
- Multiple Chart Types: Bar, Line, Pie, and Stacked Charts.
- Compare Data Over Time: Analyze metrics day-by-day, week-to-week, or against previous years.
- Multi-Chart Support: Layer multiple charts for side-by-side comparison.
🎛️ Toolbar Options
| Button | Function |
|---|---|
| 🎨 Draw Chart | Plots the selected data instantly |
| ➕ Add Chart | Layers a new chart on top of the existing graph |
| 💾 Save Options | Saves the current configuration for later reuse |
| 🔄 Undo Chart | Removes the last plotted chart |
📥 Export and Share Insights
Easily export charts to PDF or image formats, share with team members, or print for meetings. Save frequently used configurations for quick access during planning sessions.
💡 Use Cases
- Track daily admissions vs discharges for capacity planning
- Analyze patient flow by ward and identify bottlenecks
- Visualize revenue trends across different service categories
- Audit prescription and laboratory trends over time
🟦 Ward Statistics
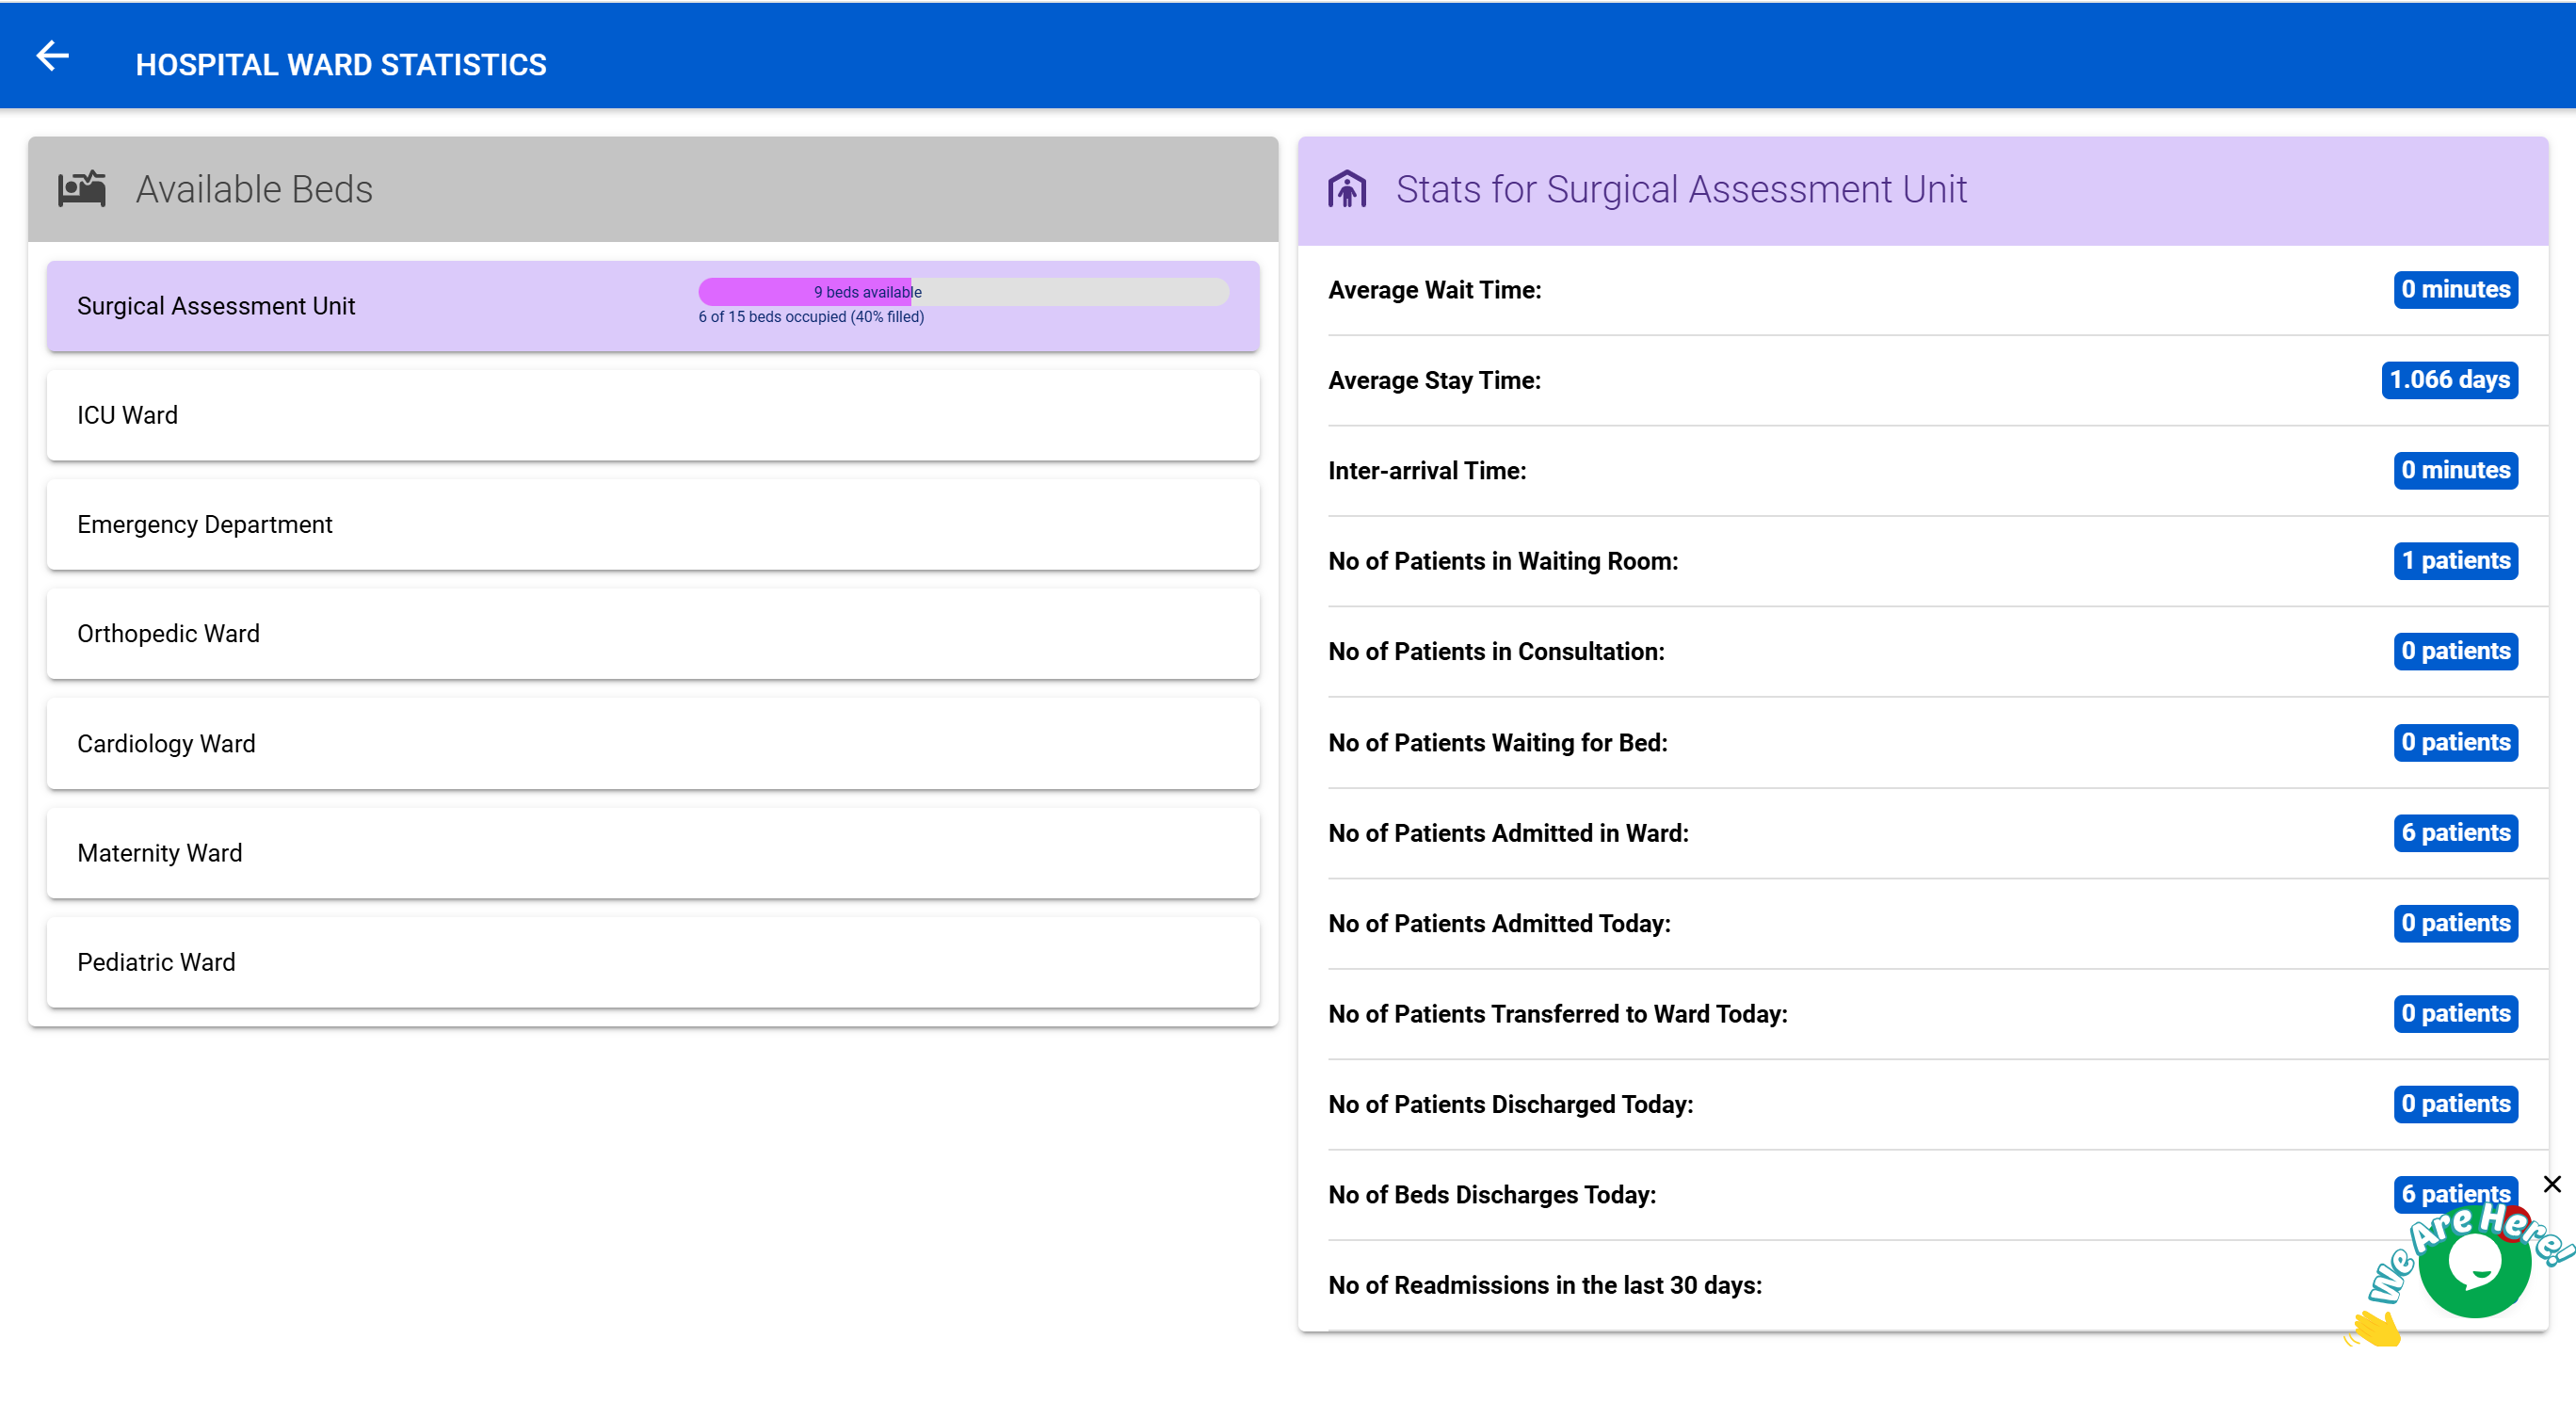
The Ward Statistics page offers hospital managers a comprehensive overview of ward performance in real-time. With clear metrics and a user-friendly layout, it’s designed to empower decision-making and improve operational efficiency.
At a glance, you can see key performance indicators (KPIs) for each ward, monitor patient movement, and track bed utilization to anticipate demand and manage resources.
📊 Key Metrics Displayed
| Metric | Description |
|---|---|
| Available Beds | Current count of empty beds per ward |
| Occupancy Rate | Percentage of beds currently occupied |
| Average Wait Time | Average time from admission request to bed assignment |
| Average Stay Duration | Mean length of stay for admitted patients |
| Readmissions (30 Days) | Number of patients readmitted within 30 days |
| Transfers Today | Number of patients moved into or out of this ward today |
| Discharges Today | Number of beds vacated due to patient discharge |
Managers can switch between wards instantly and access live data feeds, making it easier to plan cleaning cycles, staff shifts, and anticipate bottlenecks.
💡 Example Use Cases
- Identify wards nearing full capacity to prioritize transfers
- Monitor patient flow during high-demand periods
- Measure average stay times for process improvement initiatives
🟪 Forecasting & Predictive Analytics
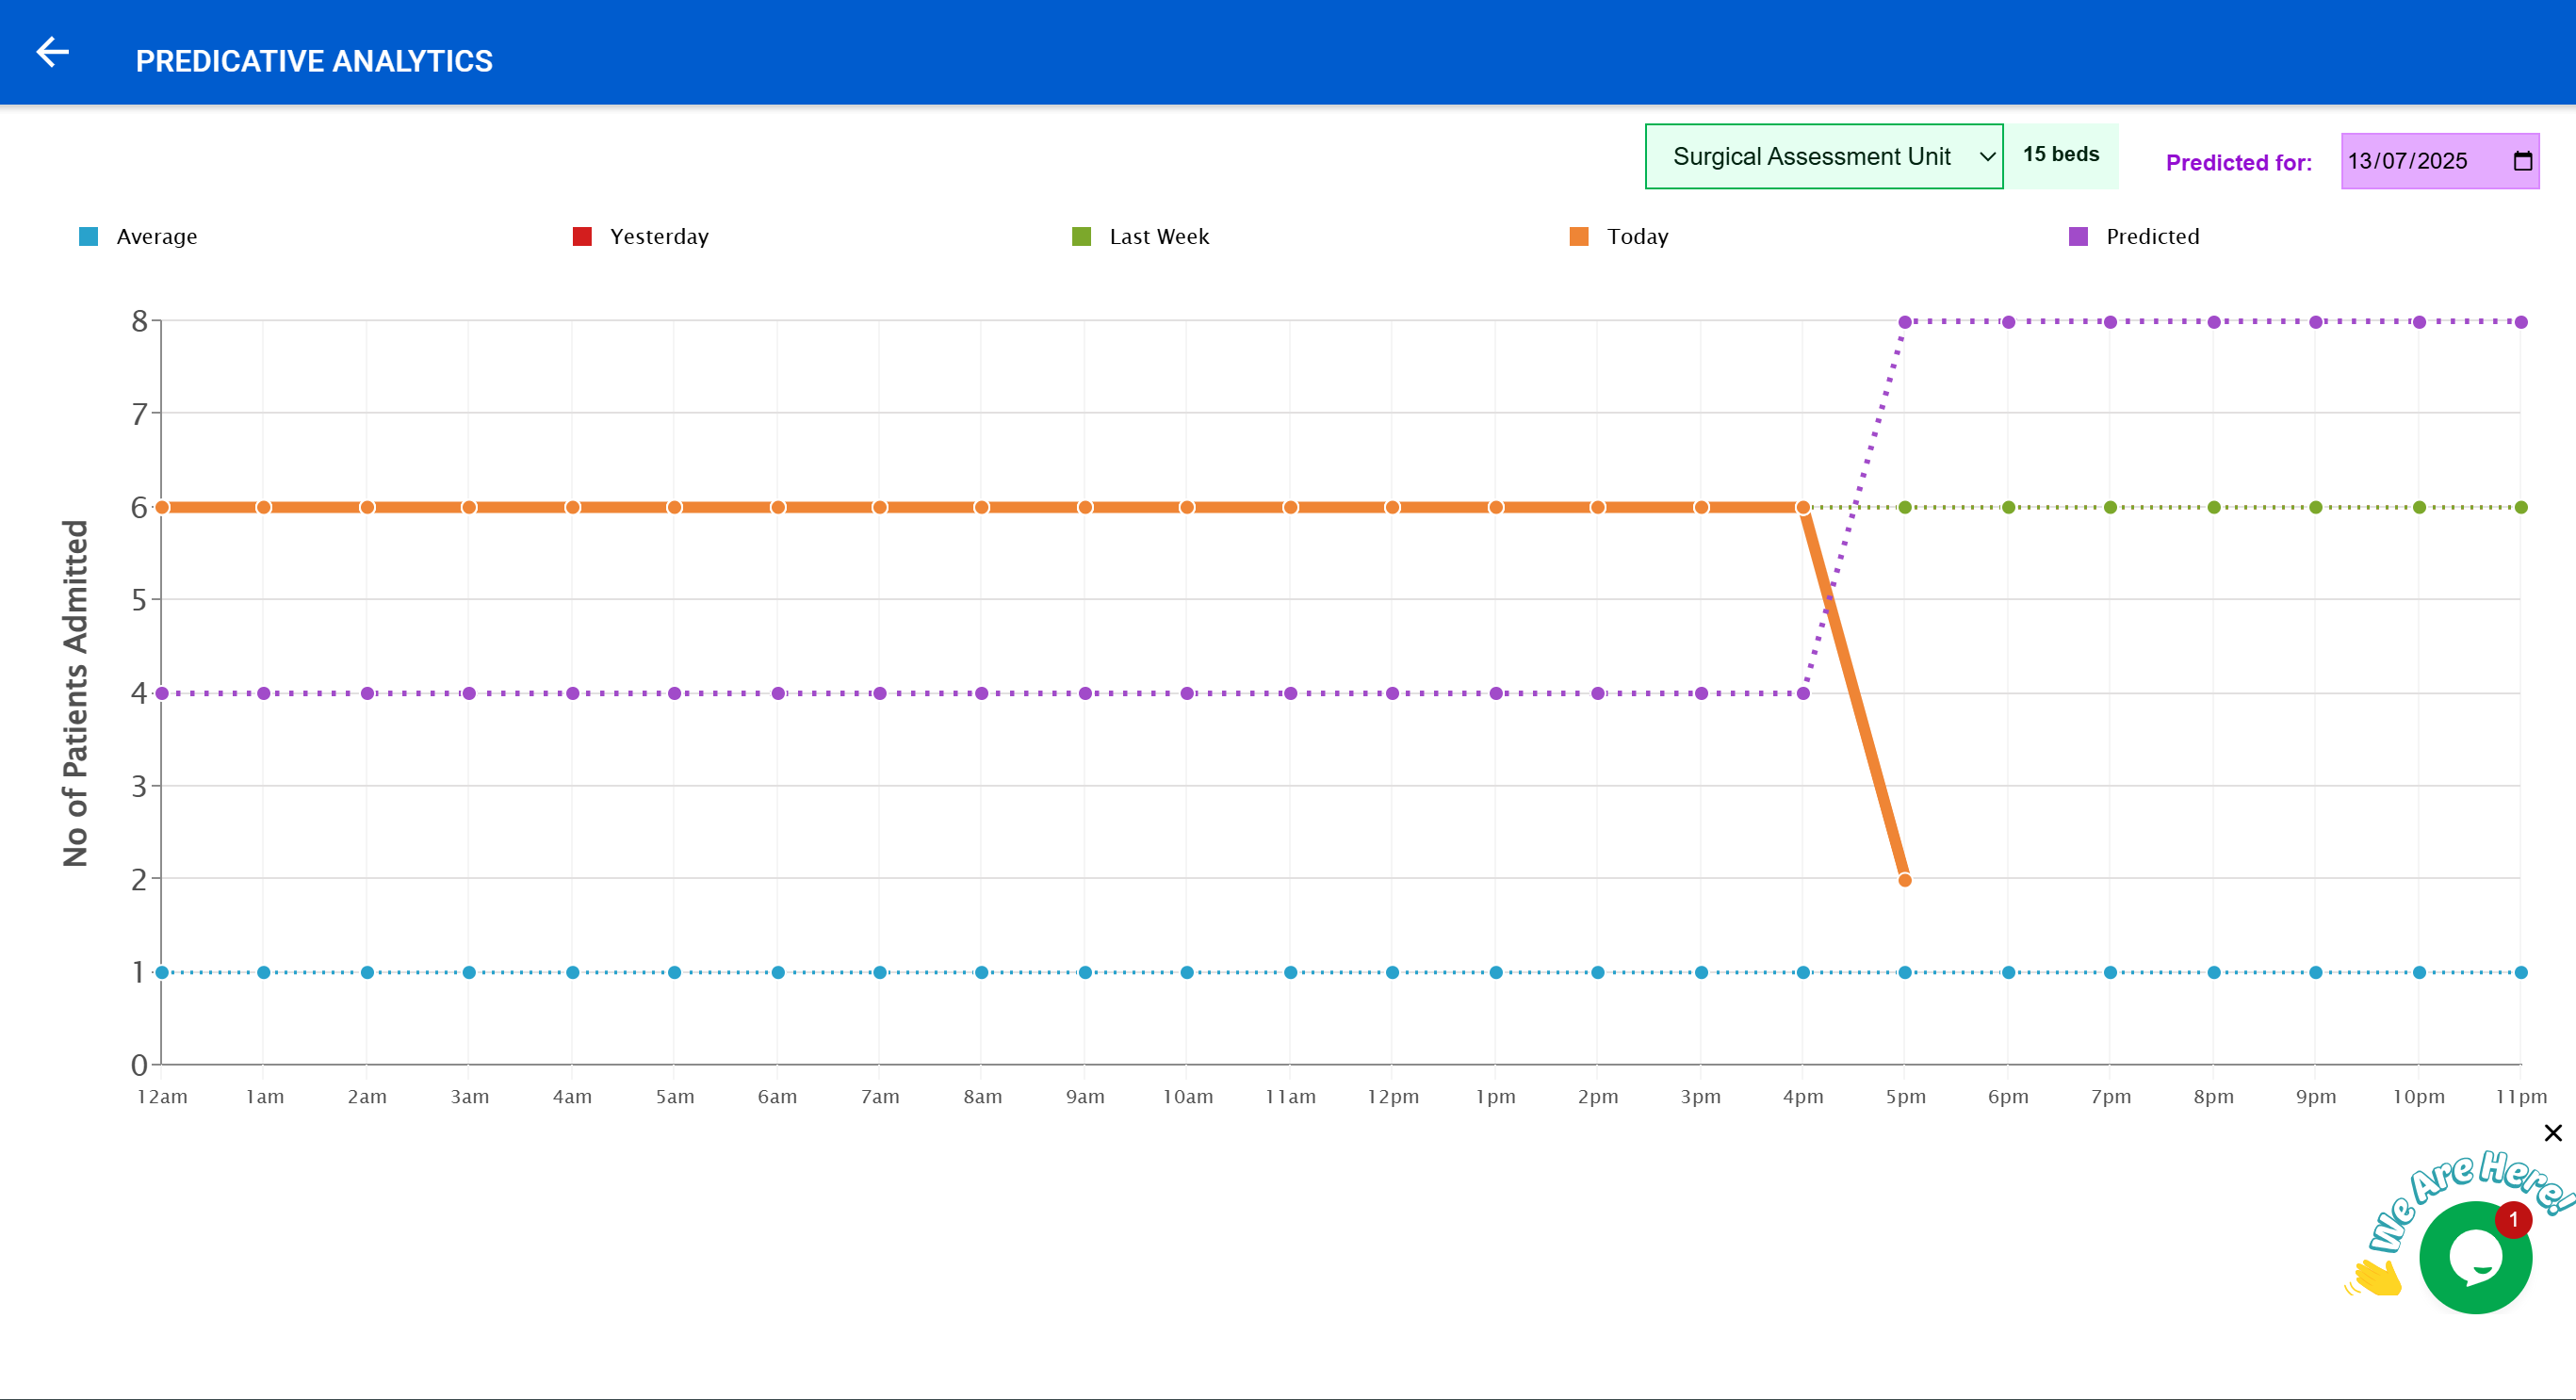
The Forecasting page equips hospital managers with AI-powered insights to predict patient flow and prepare for upcoming surges. Using historical data and trends, the system offers reliable projections to support operational planning and resource allocation.
With this tool, managers can anticipate bed demand, adjust staffing levels, and schedule cleaning or maintenance cycles to ensure seamless patient care.
🔮 Key Features
| Feature | Purpose |
|---|---|
| Predicted Admissions | Estimates patient inflow for selected dates |
| Comparison Charts | Compare predictions with yesterday, last week, and daily averages |
| Hourly Trends | Visualize admissions on an hour-by-hour basis |
| Admission Source Breakdown | Identify admissions from A&E, transfers, or direct entries |
The predictive analytics module empowers you to make data-driven decisions and avoid bottlenecks, ensuring beds and staff are ready for patients when they arrive.
💡 Example Use Cases
- Forecast daily and weekly ward occupancy levels
- Prepare staff rosters ahead of high-demand periods
- Plan cleaning and turnover schedules to match predicted discharges
🟦 Dynamic Scheduling & Appointments
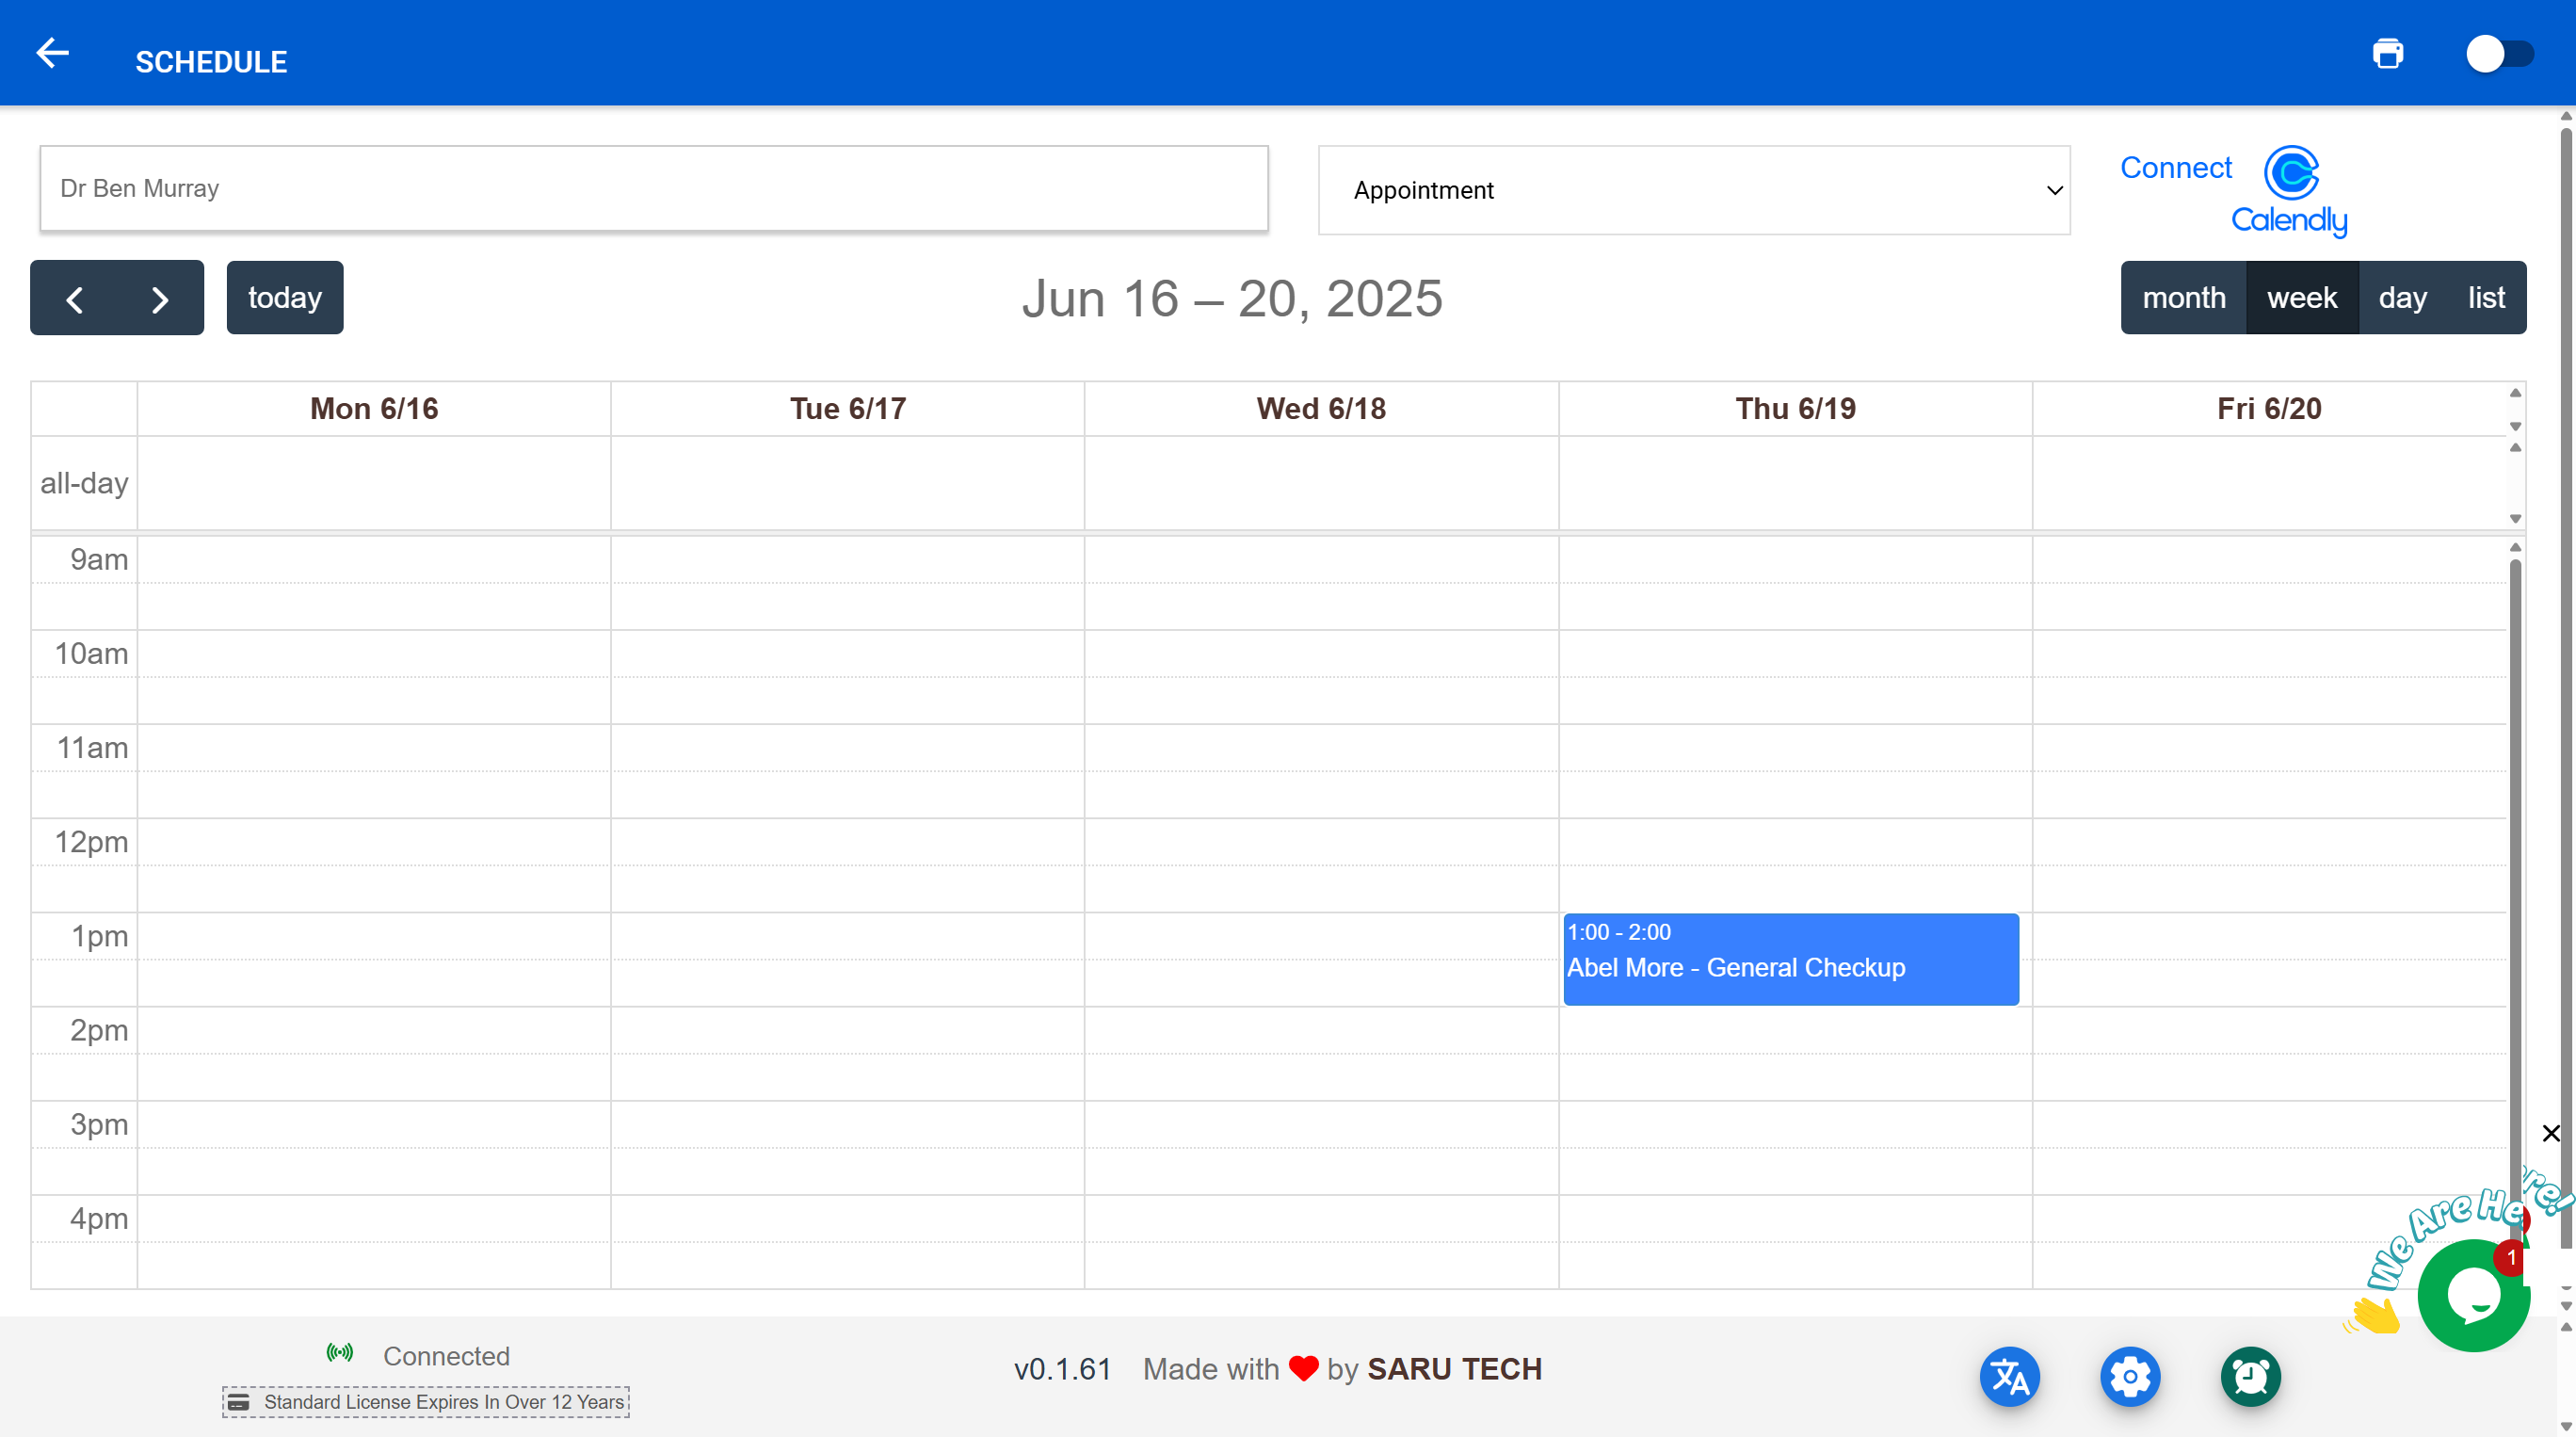
The Appointments Calendar provides an interactive view of all ward bookings, admissions, discharges, and other scheduled activities. This dynamic tool helps staff manage workflows efficiently, ensuring that no patient or task is missed.
The system supports color-coded entries for different appointment types, drag-and-drop adjustments for rescheduling, and integration with patient records for a seamless experience.
📅 Key Features
| Feature | Description |
|---|---|
| Interactive Calendar | View daily, weekly, or monthly schedules |
| Drag-and-Drop Editing | Easily reschedule appointments by dragging |
| Real-Time Updates | Automatically syncs changes across devices |
| Patient Linkage | Each appointment connects directly to patient files |
Staff can filter appointments by doctor, ward, or appointment type to stay focused on their priorities. The intuitive interface reduces scheduling conflicts and increases operational efficiency.
💡 Example Use Cases
- Track bed reservations and planned discharges
- Coordinate multidisciplinary rounds and treatments
- Quickly locate available time slots for urgent admissions
🟪 Insurance Reconciliation & Management
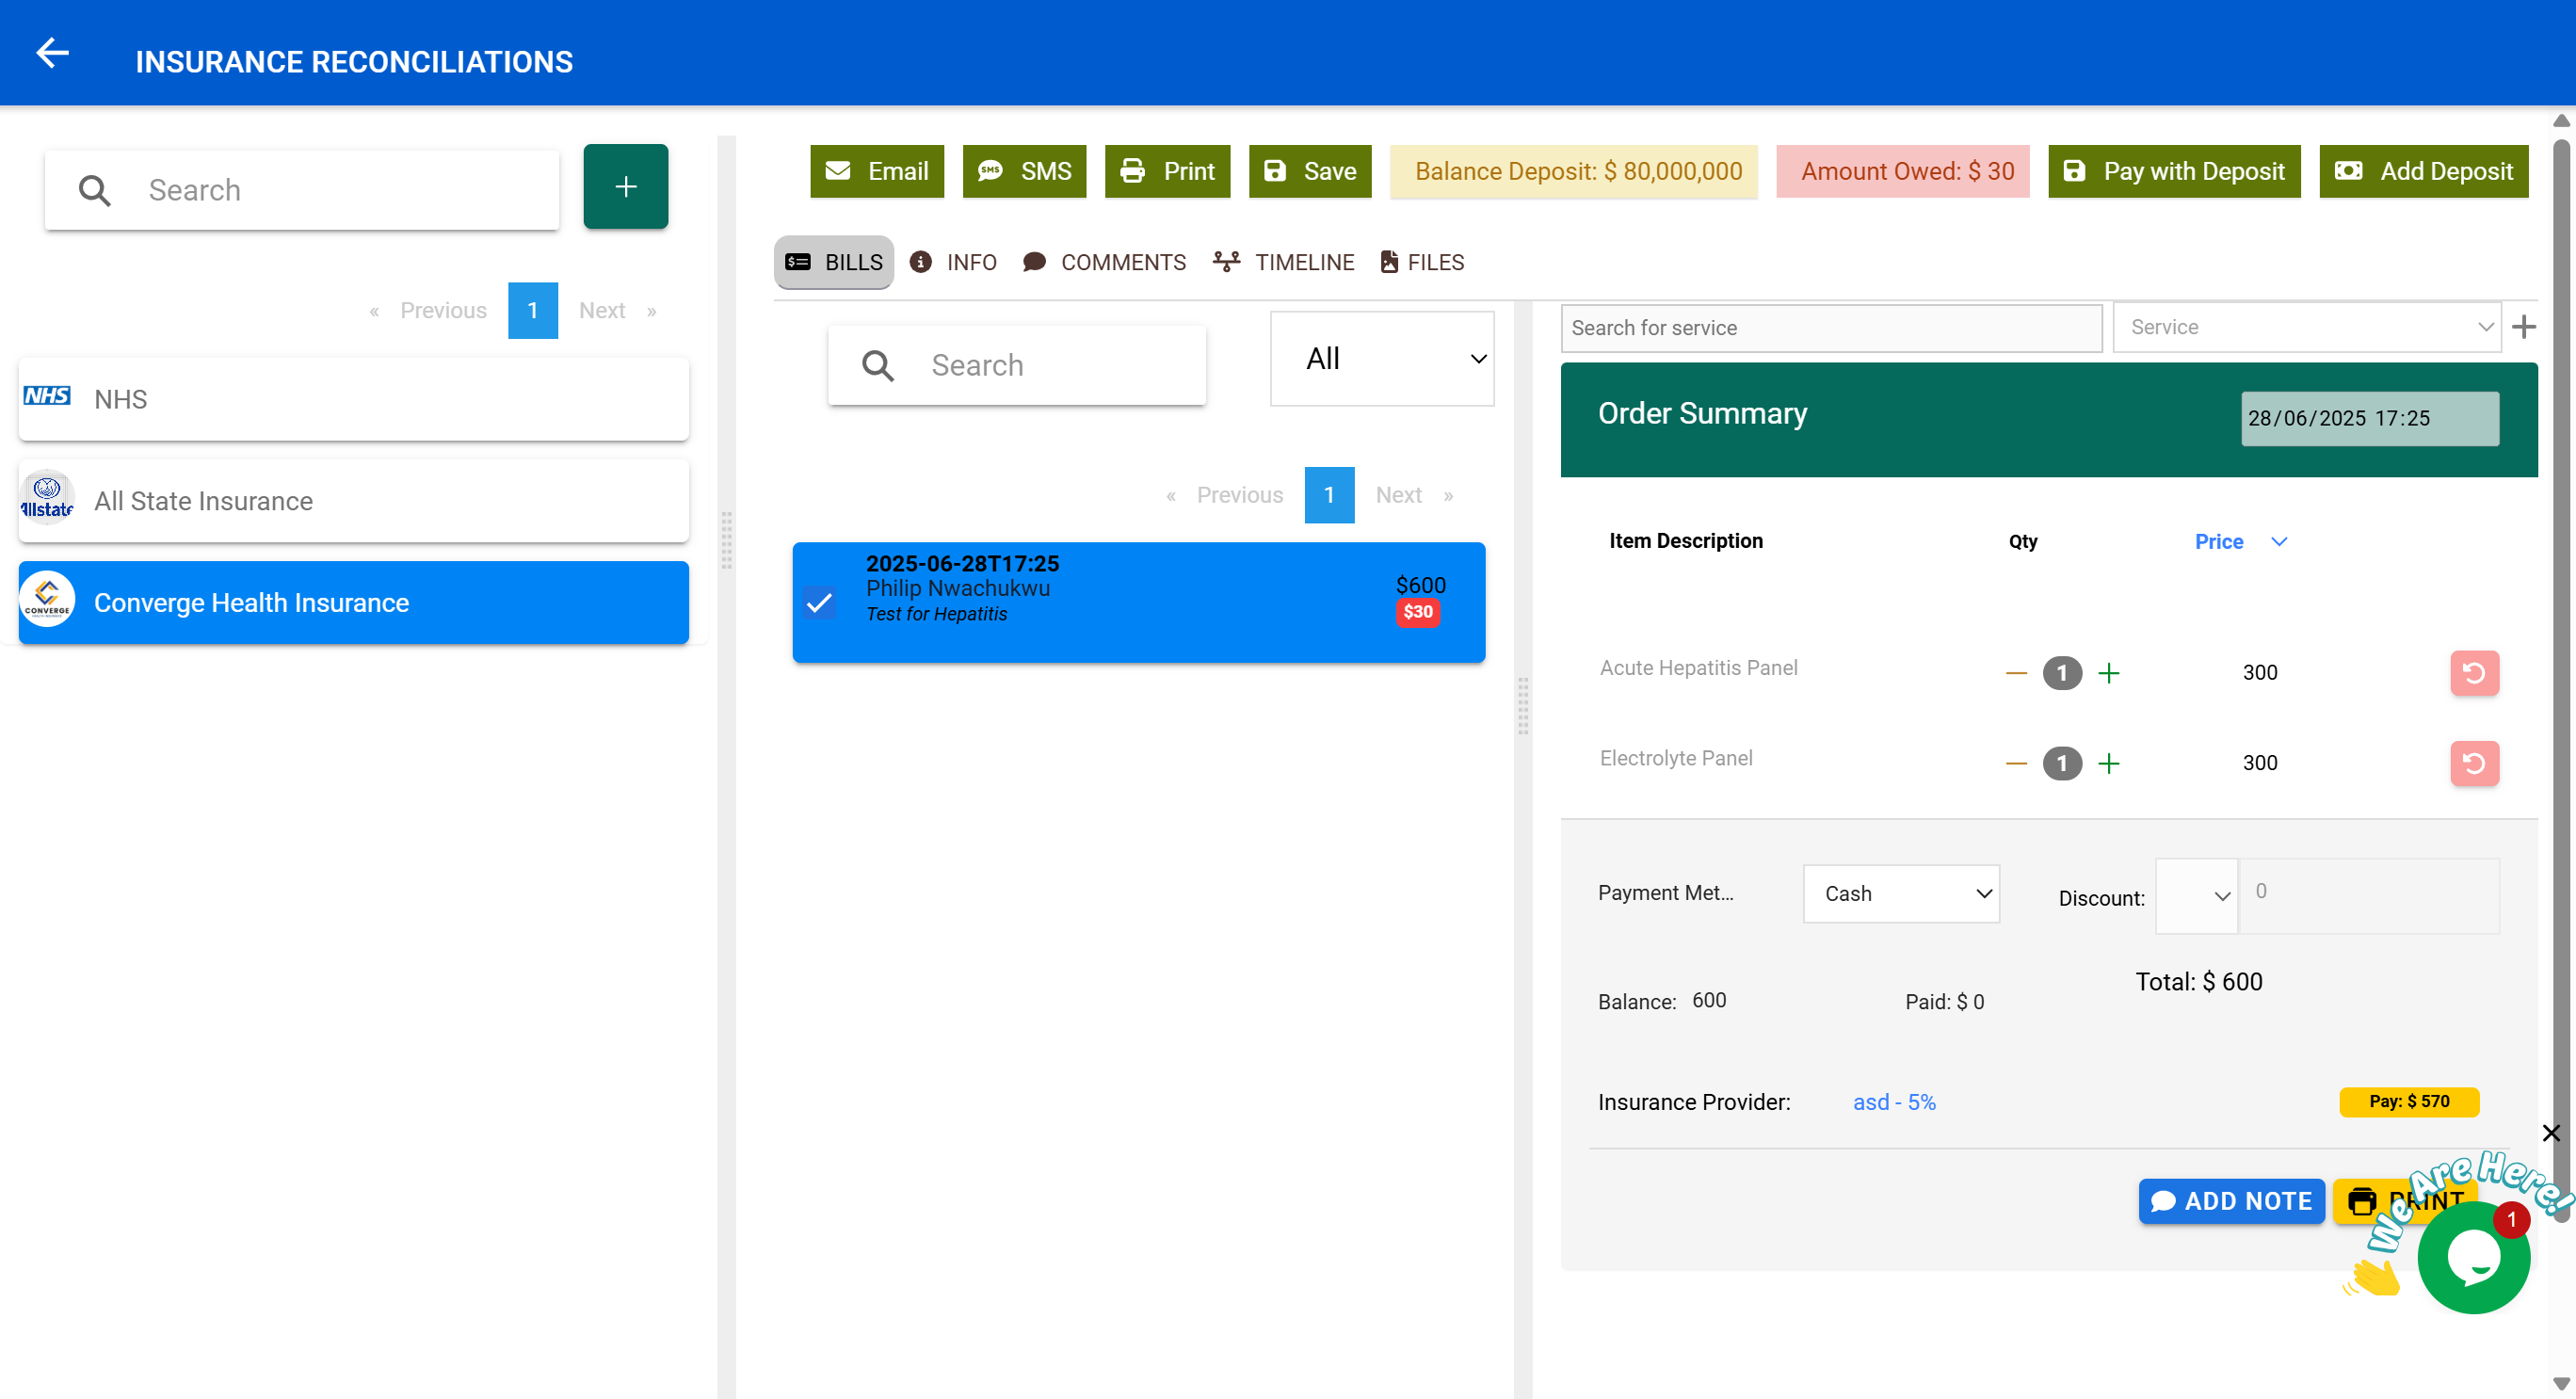
The Insurance Reconciliation Dashboard simplifies financial operations by offering tools to track, verify, and manage insurance claims for every ward. This ensures that all patient visits, treatments, and procedures are accurately billed and reconciled with their respective insurance providers.
By centralizing insurance management, hospitals reduce billing errors, prevent revenue leakage, and improve overall financial transparency.
💼 Key Features
| Feature | Description |
|---|---|
| Claim Verification | Automatically checks patient coverage and eligibility |
| Batch Reconciliation | Compare internal billing with insurance reports |
| Detailed Audit Trails | Tracks every edit, approval, and payment |
| Exportable Reports | Generate insurer-specific summaries in PDF or Excel |
With direct integration into the Perfect Billing System , the module streamlines communication between clinical and finance teams, ensuring timely claim submissions and follow-ups.
💡 Example Use Cases
- Track unpaid claims across multiple wards
- Identify discrepancies between billed and paid amounts
- Generate insurer-specific reconciliation reports for audits