In addition to real-time operations, the Perfect Hospital Bed Management System equips you with powerful analytics tools to support planning, staffing, and operational efficiency. This includes:
- 📈 Ward Statistics – Live performance metrics
- 🔮 Forecasting – Predict future patient inflow
- 🗓 Booking History – Analyze past bed activity and flow
📈 A. Ward Statistics Panel
🧭 Access:
Click the “Stats” button in the top toolbar.
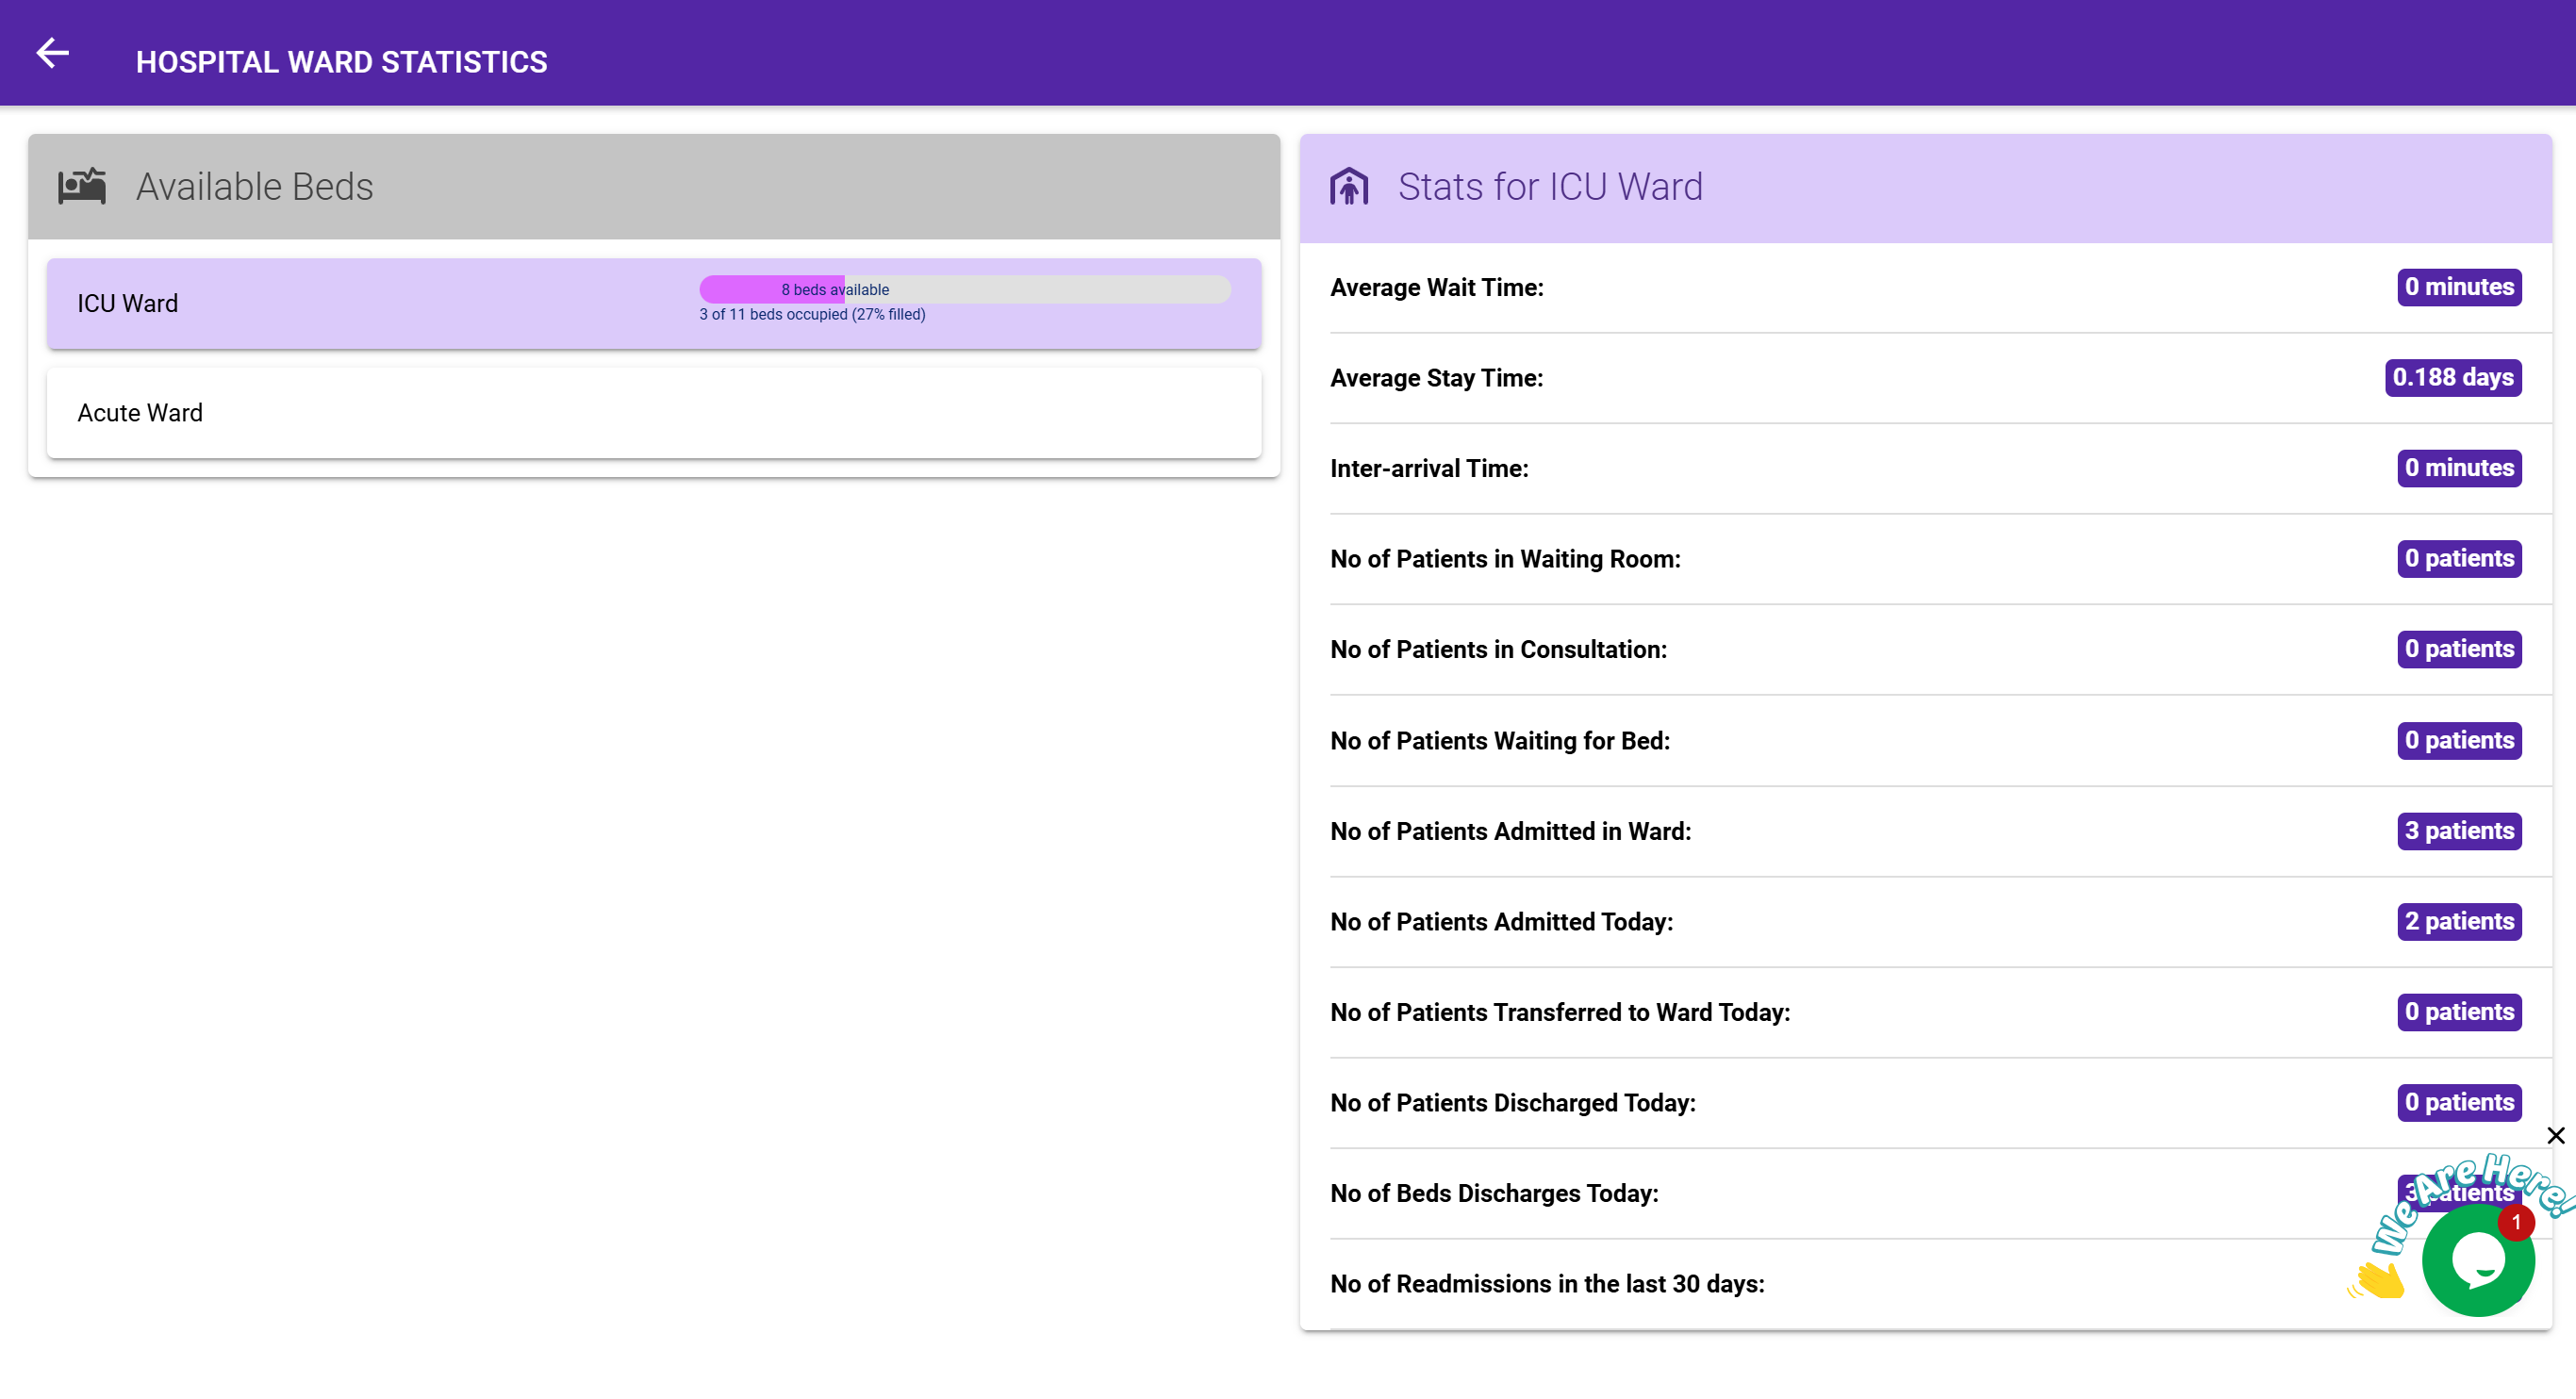
📊 What You’ll See:
A two-panel layout displaying:
- All wards on the left
- A detailed statistical breakdown for the selected ward on the right
Metrics Displayed:
| Metric | Meaning |
|---|---|
| Available Beds | Real-time number of empty beds |
| Occupancy Rate | Percentage of beds in use |
| Average Wait Time | Avg. time between admission request and assignment (in minutes) |
| Average Stay Time | Avg. duration patients stay before discharge (in days) |
| Interarrival Time | Time between two successive patient arrivals (in minutes) |
| Patients in Waiting Room | Number awaiting admission |
| Patients in Consultation | Number still in assessment stage |
| Patients Waiting for Bed | Queued for bed assignment |
| Admitted Patients | Total currently in the ward |
| Admitted Today | Number of admissions today |
| Transferred In Today | Number of patients moved into this ward today |
| Discharged Today | Number of patients released today |
| Beds Discharged Today | Beds vacated due to patient discharges |
| Readmissions in Last 30 Days | Number of returning patients in past 30 days |
🔄 Switching Wards:
Click any ward name on the left panel to instantly view its stats on the right.
🧠 These insights help you anticipate pressure points and optimize staffing and cleaning cycles.
🔮 B. Forecasting & Predictive Analytics
🧭 Access:
Click the “Forecast” button from the top toolbar.
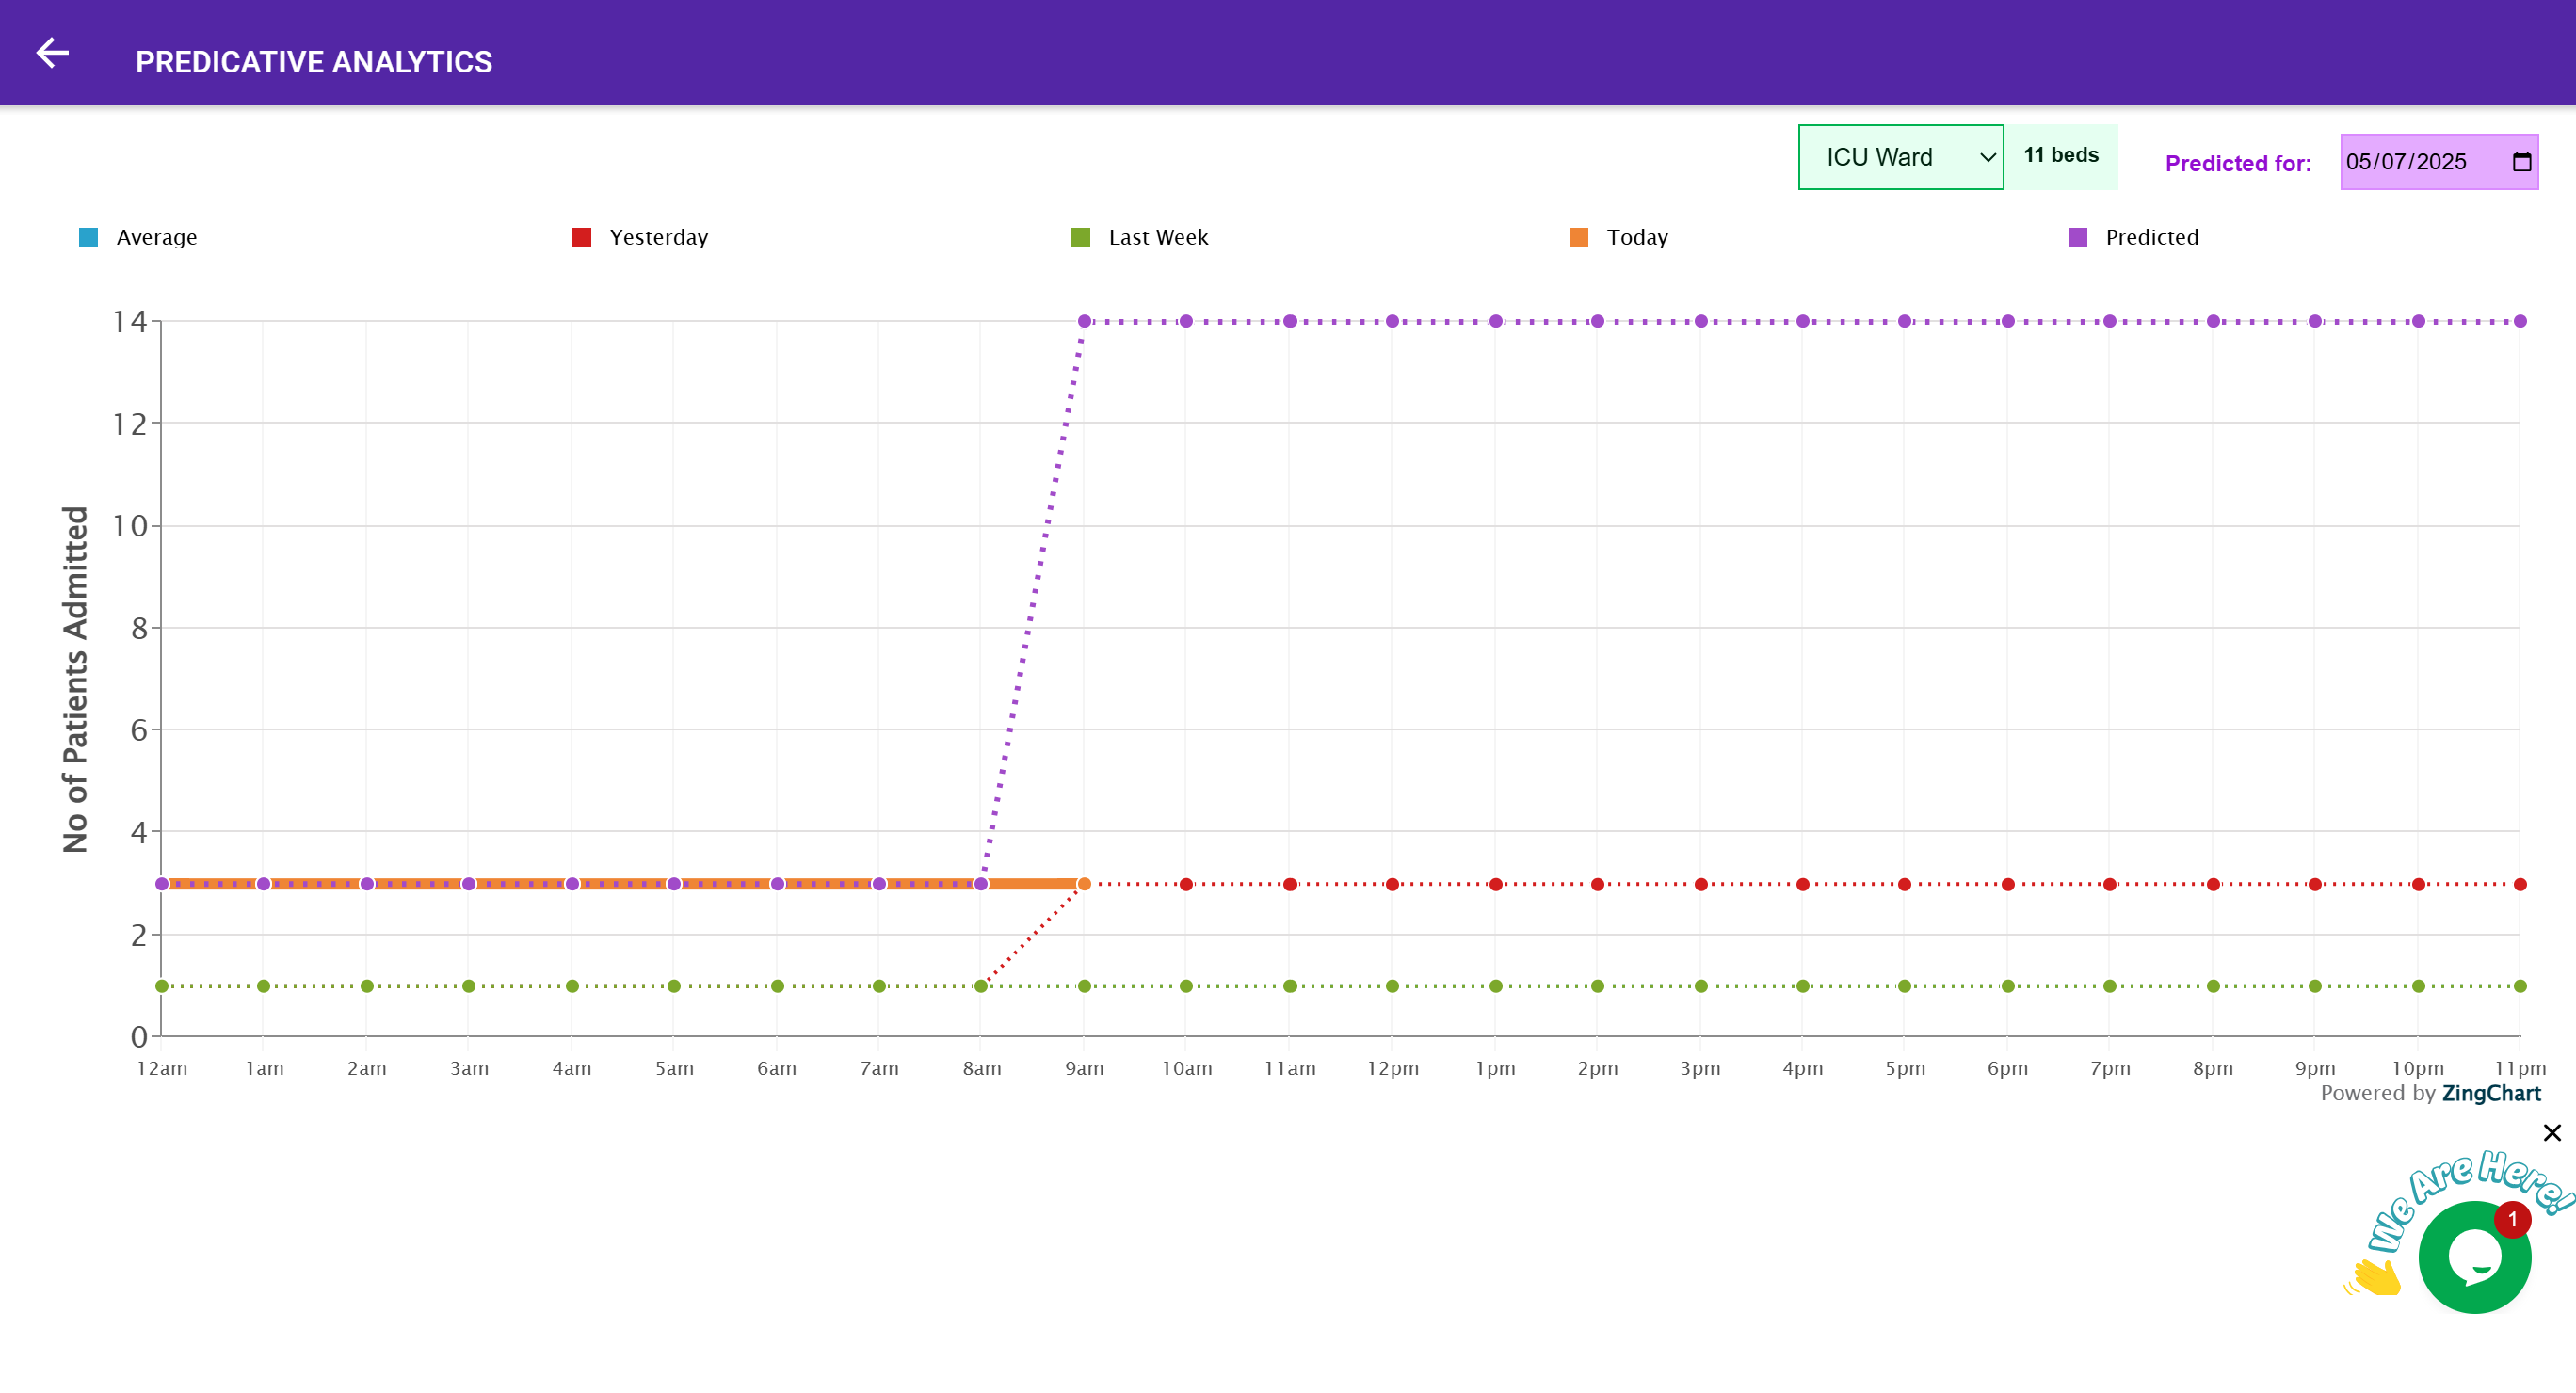
📍 What It Shows:
- A prediction of the number of patients likely to be admitted on a selected date.
-
Comparison with:
- Average daily admissions
- Yesterday’s admissions
- Same day last week
- Admissions so far today
📅 Changing the Forecast Date:
Use the date picker to choose any upcoming date.
📊 Behind the Scenes – What the System Considers:
- Hourly patterns of past admissions
- Current ward occupancy
- Scheduled discharges and transfers
- Average stay duration
- Infection status and room turnover time
- Elective and emergency admission trends
📈 Chart View:
A ZingChart-powered visual graph helps interpret trends easily.
📌 Use this data to schedule nurses, cleaners, equipment, and make bed allocations more proactive.
🗓 C. Booking History – Bed Timeline
🧭 Access:
Click the “Booking History” button in the top toolbar.
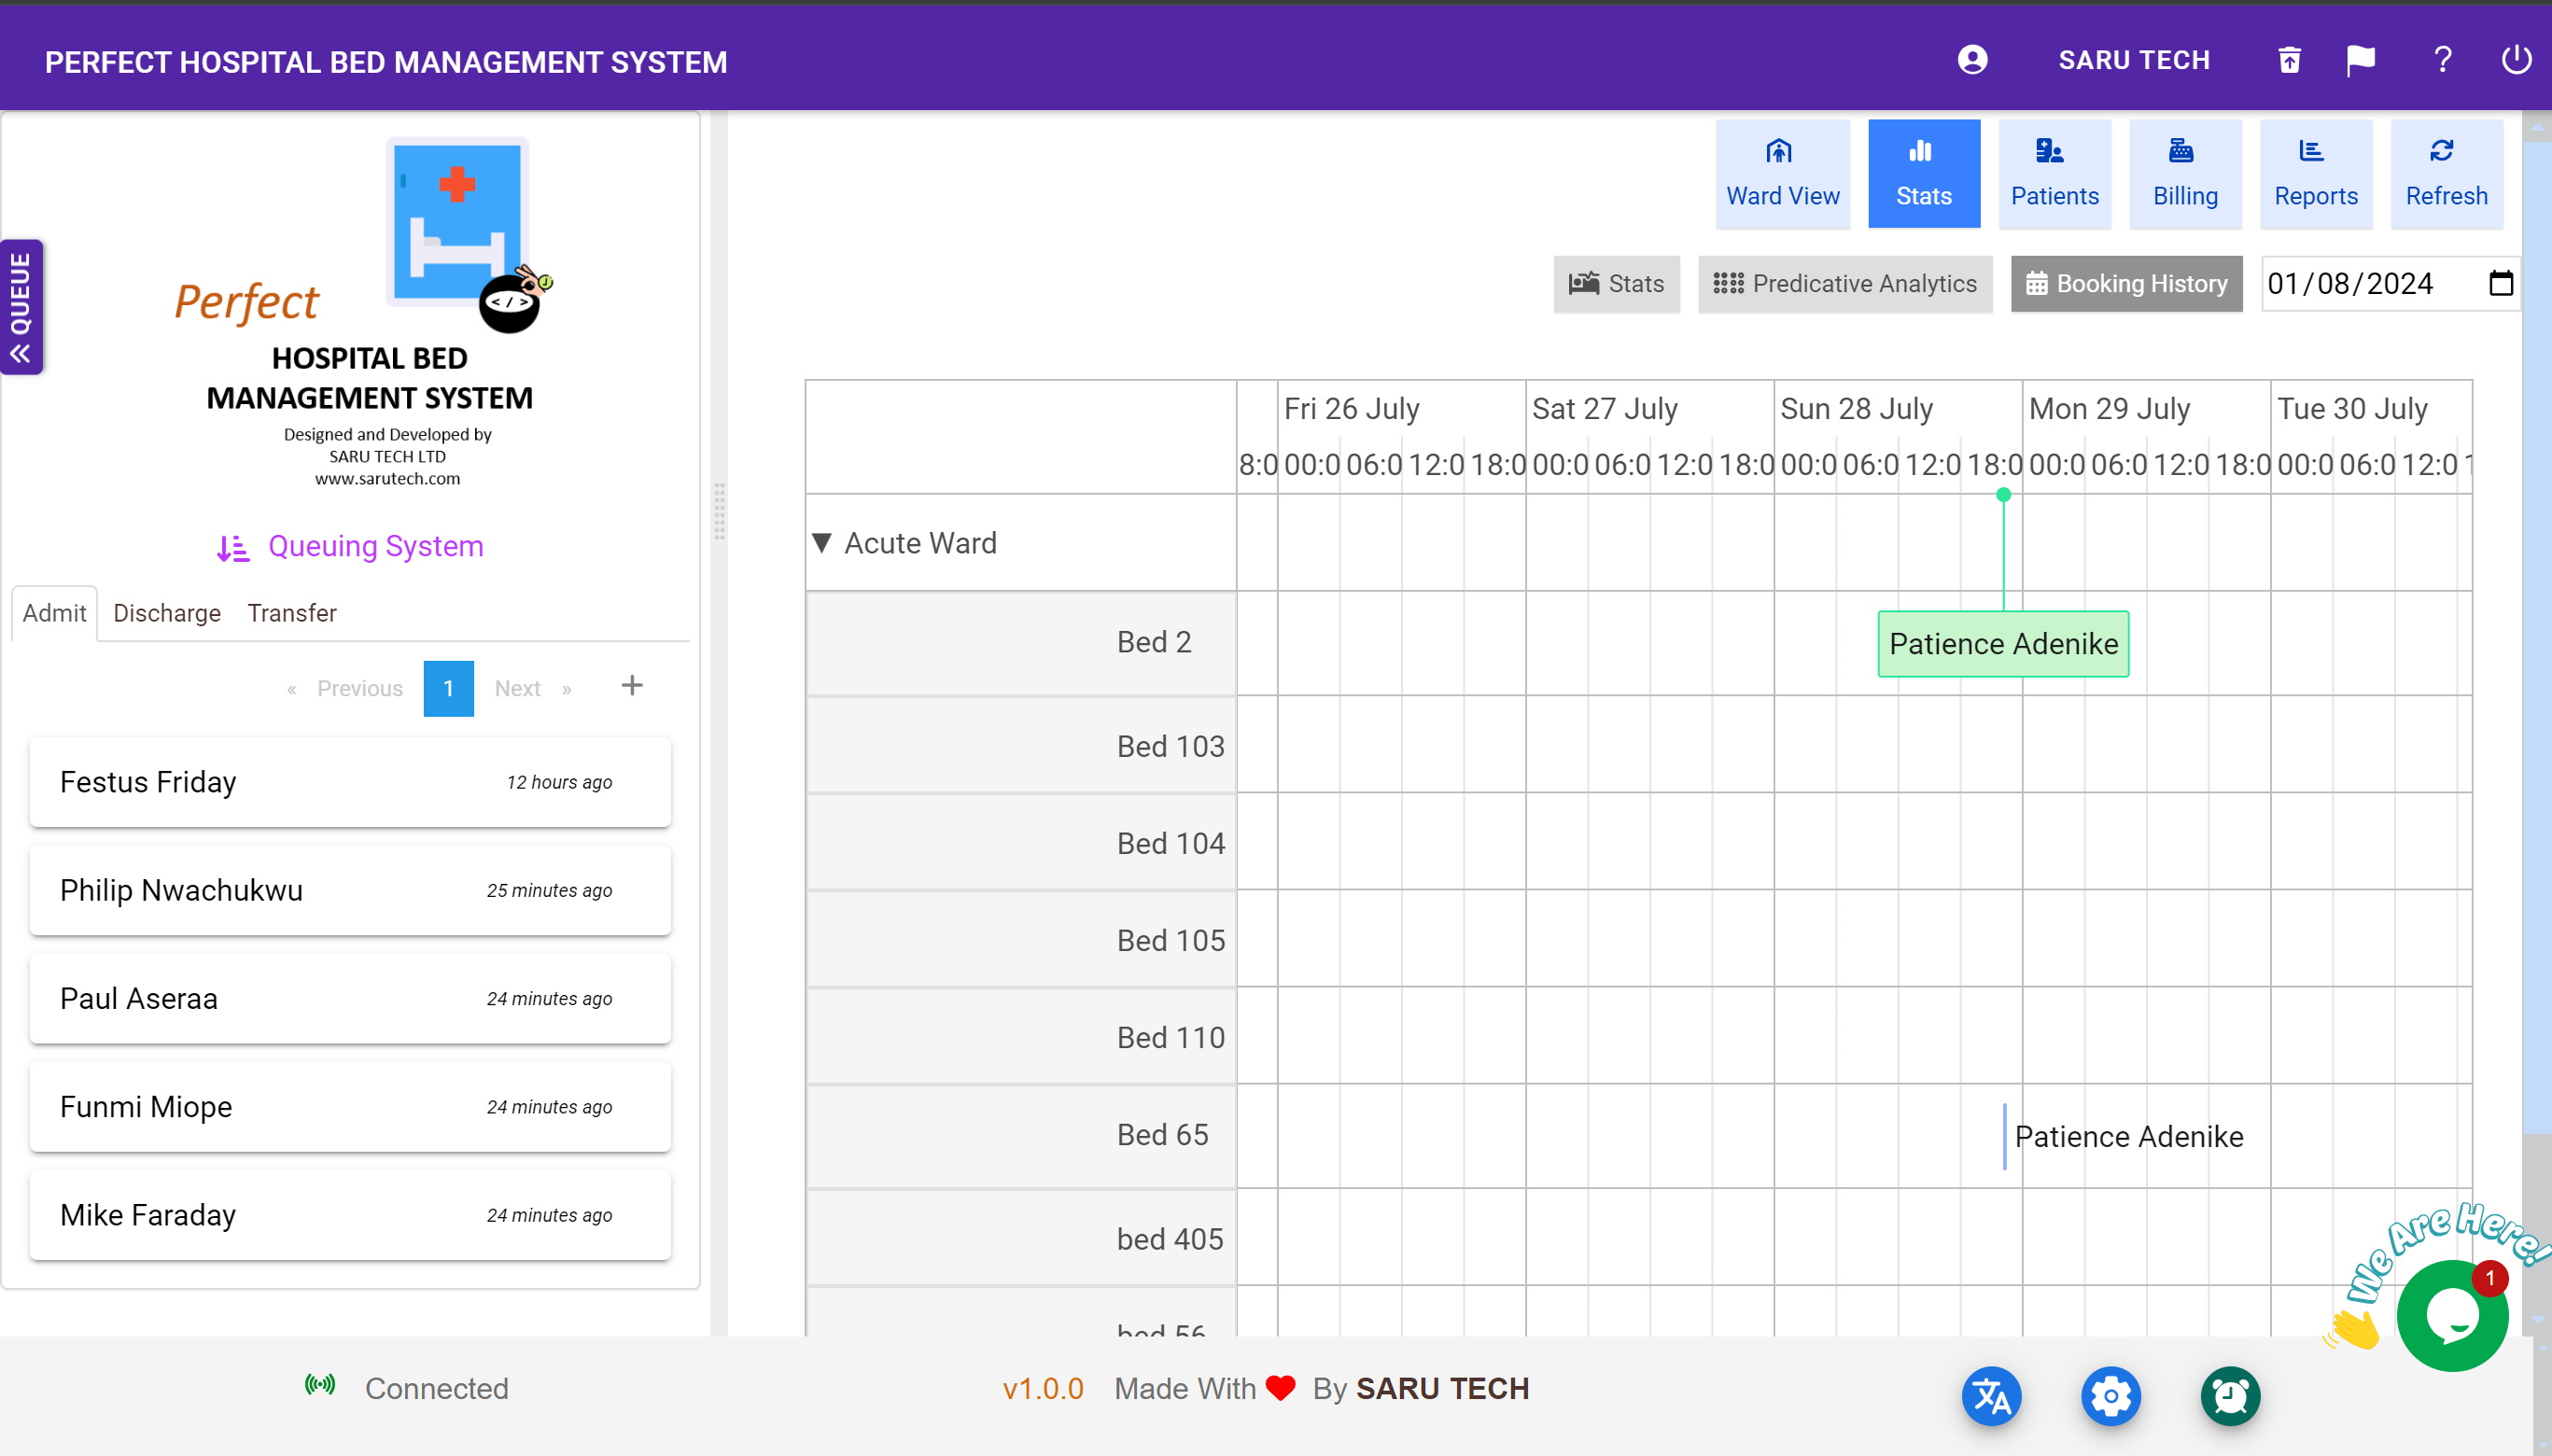
📌 What It Does:
Displays a timeline view of all patient-bed interactions for a specific day.
- Each bed is shown as a timeline track
- Each patient stay is represented as a colored block
- Shows exact time ranges and durations
- Includes admissions, transfers, and discharges
🧭 How to Use:
- Select the date using the date picker.
- Choose a ward .
- The chart updates to reflect historical movements.
🧠 Helps with audits, identifying bottlenecks, and confirming real usage patterns for each bed.